Table of Contents
- 1. An Overview Of OnPing
- 2. Lumberjack Application System
- 3. Data Management System
- 4. OnPing Visualization and Frontend
- 4.1. Custom Tables – arbitrary tables used to assemble data into meaningful displays for users
- 4.2. HMI – Human Machine Interface, graphical displays designed to mimic machine style ones.
- 4.3. Graphs and Trends – Time series graphs to display changes over time.
- 4.4. Maps – Add geo-spatial data to OnPing.
- 5. OnPing Identity Management
- 6. Alarm System
- 7. Virtual Parameters
- 8. Managing Complexity
1 An Overview Of OnPing
OnPing is a suite of data and device management systems designed to make interacting with industrial machine data simpler. This document is an attempt to walk through all the various systems involved in OnPing one by one.
There are lots of capabilities and interacting parts involved in OnPing and it can be overwhelming. However, having everything written down in one place can be a good way of finding one part you understand and using it to understand others.
This document is intended to reveal the relationship between systems in OnPing. It serves a secondary purpose as a reference for people trying to architect similar systems. There are a lot of moving parts!
1.1 Major Systems in OnPing
OnPing has a lot of moving parts. Below, each box represents a major system in OnPing. This diagram is not a total list of the parts and pieces of OnPing, but it does give a sense of the way data flows through the system. Any particular block actually might represent a dozen separate systems that can be thought of together.
This simplified view is useful to see how much is involved in an effective data and device management system:
2 Lumberjack Application System
The Lumberjack Application System (LAS) is an application manager designed to run on top of a Linux build. It contains drivers for an extensive set of industrial devices including those with manufacturer specific protocols.
OnPing’s systems access these devices directly and send data to and from them easily. LAS is designed to run on very small devices, as small as a Raspberry Pi or ODROID device.
Every running application on the LAS is completely managed. The data it contains is backed up. The network settings it has are remotely configurable. The system makes every effort to minimize the amount of data sent over the wire back to its sources. A Permissions and Identity system are both stored locally and sync’d with cloud devices.
OnPing’s Lumberjack Application System takes security seriously: all data is encrypted and all transmission is client initiated – eliminating the need for static IPs that so often become vectors for attack. Permissions on the network can be revoked remotely.
All this attention to the networking and security settings upfront is essential to the design of everything else in OnPing. The goal is to create a system that handles these issues at the ground level so that everywhere else you can just talk about Lumberjack A talking to Lumberjack B and that is it.
3 Data Management System
The Data Management systems encompass the ways we store historical and configuration data.
Data flows from the Lumberjacks to the data management system. The important parts are:
- RTU Client – Lumberjack application responsible for interacting with various drivers and applications running on the lumberjack.
- RTU Manager – Server side application responsible for gathering data from lumberjacks and feeding it to cloud applications.
- TachDB (time series database) Reads data from field devices and stores in a multi-resolution format for quick display.
- TachDB Recovery – System where data is recovered as chunks in the event of comm loss.
3.1 RTU Client
RTU Client links all the drivers that pull data from various devices in a Lumberjack Application System. It mixes this data with permissions and allows applications to manipulate this data locally with a unified interface. In addition it manages data pushes to RTU Manager, which maintains a server side cache of this data. The emphasis is on the word cache. The source of truth for data in OnPing is always what is closest to the machine.
3.2 RTU Manager
RTU Manager provides parameter data to all the cloud services that interact with data in OnPing. It is responsible for receiving all data from devices running LAS. It pushes data to TachDB and is designed to be highly available for very fast queries in OnPing.
3.3 TachDB
TachDB is our time series database. It is designed to allow very fast multi trend data requests. Data is stored in approximation intervals of finer and finer resolution until you get to the real value. TachDB lets us trend 100s of parameters across massive timelines incredibly fast. It has many techniques to help with some common problems with time series data.
3.4 The TachDB Recovery
TachDB Recovery sends data over in the event of a communications outage. Many systems that do this send the data in the same format as the original system. This often leads to data choke points. By sending the data in a highly compressed format we avoid these issues.
4 OnPing Visualization and Frontend
Currently much of the visualization system resides in the OnPing binary directly, but as each part is asked to do more this will continue to evolve – visualizations included.
4.1 Custom Tables – arbitrary tables used to assemble data into meaningful displays for users
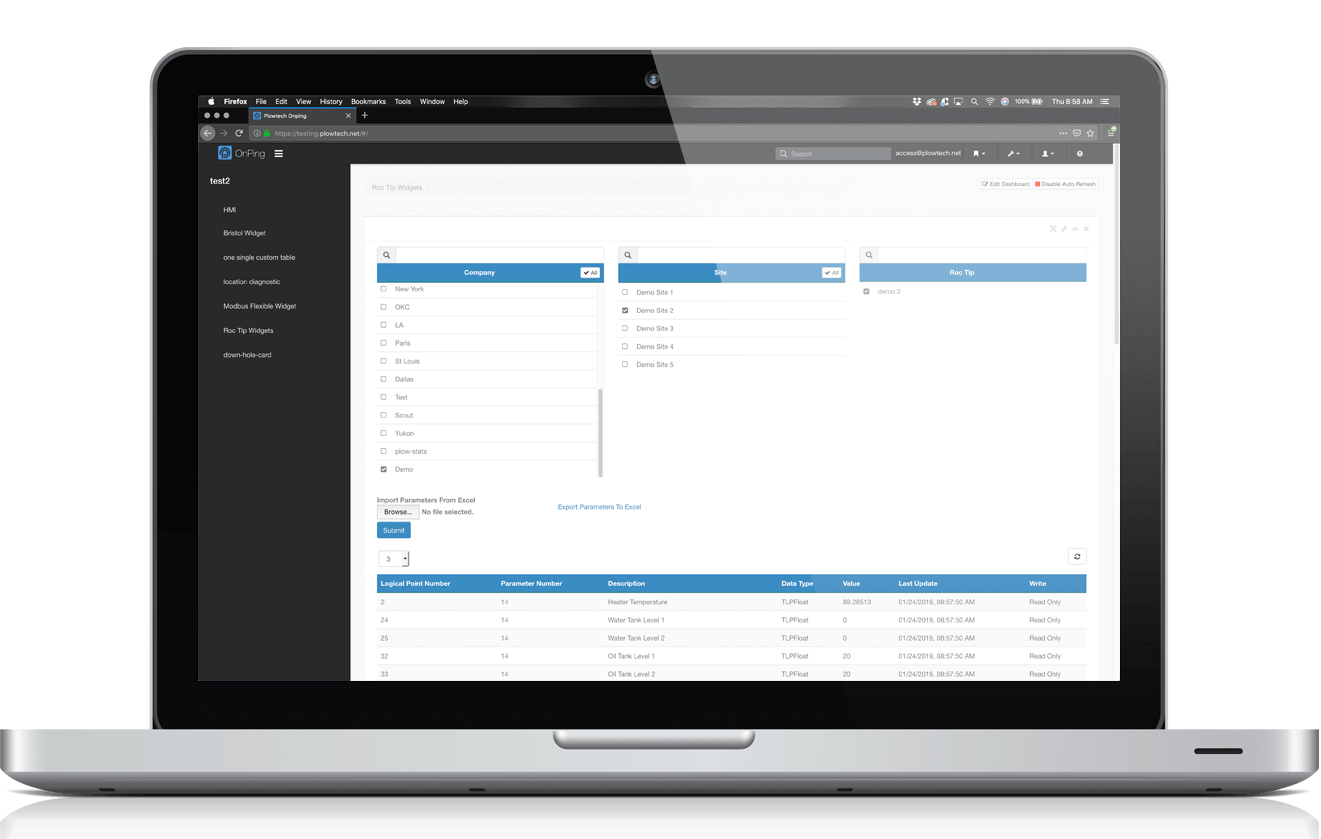
Custom Tables started out as a way of allowing our customers to display data in arbitrary ways. More and more, they now provide structure and meaning to the data in OnPing. It is not uncommon to see tables used to organize machines across a company or particular stats from various locations.
Tables are used to generate reports and serve as inputs for templates or maps. These are are extremely flexible tools that enable much of the customization in OnPIng.
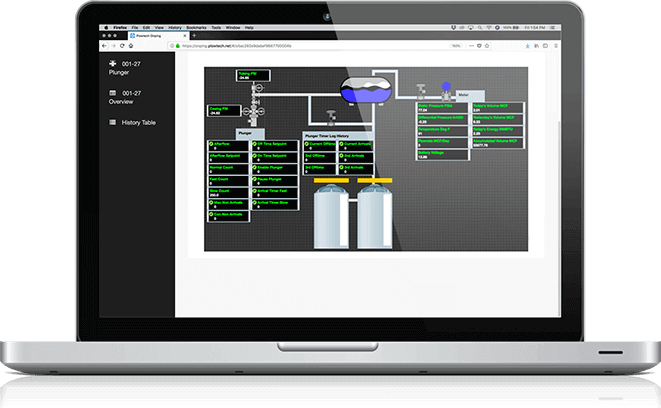
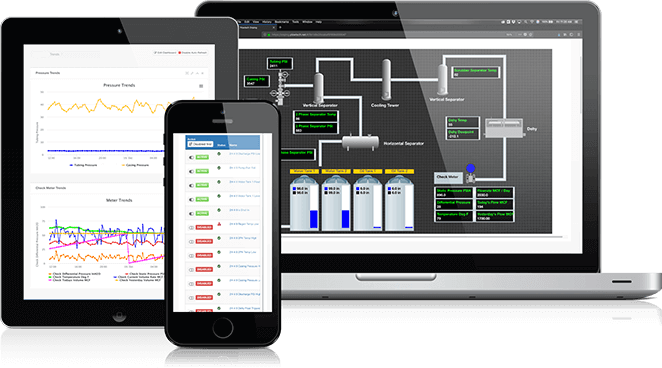
4.2 HMI – Human Machine Interface, graphical displays designed to mimic machine style ones.
Our HMI system can connect data from devices into simplified views – regardless of geographical distance or protocols and device compatibility.
They can be then shared and linked together to form intricate, highly configurable systems.
The HMI in OnPing are also localizeable. This means you can deploy an HMI with a separable authorization system to multiple locations. When deployed, changes to the master copy in OnPing will propagate to all other instances of the HMI.
4.3 Graphs and Trends – Time series graphs to display changes over time.
OnPing can reconfigure graph resolutions to optimize performance in relation to loading speed or granularity as needed.
Different trends can be designed with multiple axis for dense data display.
4.4 Maps – Add geo-spatial data to OnPing.
OnPing gathers location info for every device being polled. This allows maps to be created ad-hoc from any Custom Table in the system.
Maps provide a great way of transforming data from wide areas into easy to understand presentations:
5 OnPing Identity Management
There are two items in OnPing that require identity management.
- The users of OnPing, this is primarily handled through the plowtech auth server.
- The lumberjacks in OnPing, this is handled through the lumberjack identity server.
Every User in OnPing has an identity based on their email address. They also have a set of groups they are members of that provide permissions for them. While different than a more common roles based authorization system, it shares many features with this approach.
5.1 The Double Rooted Tree of Users and Groups
OnPing assigns permissions using a double rooted tree structure.
- Every User in OnPing has a Parent User and a Parent Group.
- Every Group in OnPing has a Parent User and a Parent Group.
- Users can also be members of groups
The figure below shows how these relationships work. Black lines denote hierarchy, colored lines denote membership.
- Every Entity in OnPing is a member of a group and has a set of permissions.
6 Alarm System
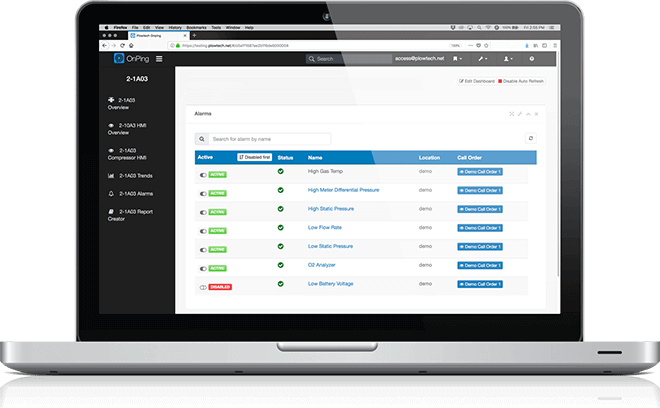
The alarm system in OnPing is split across a few different services. Alarming is a very complicated activity, but its ubiquity in automation systems often causes people to forget just how difficult it is.
A proper system must be highly distributed, highly available and dependably consistent – those things don’t mix well!
AlarmDB is responsible for combining all the components of an alarm into an unified alarm structure – ready to test and run. The tasks involved include:
- Gathering the rules about whether an alarm is in a ‘Tripped’ state
- Gathering whether an alarm has been ‘Enabled’ or ‘Disabled’
- Gathering the status of the ‘Alert’ options currently selected by users
- Combining all this information into a single presentation to be distributed.
Once this has been done it is sent to an Alarm State Server through an alarm coordinator. Alarm Coordinator presents Alarm DB with routing information. From there, the service recognizes how and where to send the data.
Alarm State Server does the state machine work and the callout work in the system. Currently, it is split into dozens of nodes, each responsible for 1000s of alarms. Alarms depend on a lot of timing rules that can be quite complicated. Once you know an alarm has tripped it still must be determined:
- How long has the alarm been tripped?
- How long until a tripped alarm should call out?
- When alarm has called someone, how long should it wait to call again?
- In case of a phone or other callout system error , how long to wait to try again?
- Should clear calls happen?
- What is the state of the Alarm? This must be checked simultaneously with the above.
Lastly, we need to Log what has happened:
- Who was alerted?
- How were they alerted?
- When were they alerted?
7 Virtual Parameters
Virtual parameters are used by alarms and visualization alike. They provide on demand calculation using OnPing-mask-script to do the calculating. They are a distributed application in much the same way our Alarm system is.
7.1 VP DB
The VPDB contains all the metadata for all the virtual parameters, and also the script database. Each Virtual Parameter has an ID (VPID), a list of sources (i.e. the parameters that the virtual parameter is made of), and a Script ID. The Script ID can be used to query the script database in order to get the actual script text.
7.2 VP Router
The job of the VP Router is 1) to store a list of addresses to VP Calculators and 2) communicate these addresses to clients. The router disperses addresses in accordance with the load assigned through VP Calculators. The addresses are listed in a YAML file and any changes to the list will be automatically loaded by the VP Router. Therefore adding or removing VP Calculators should be effortless.
7.3 VP Calculator
The VP Calculator is the process that performs the heavy task of calculating the time values of a virtual parameter. You can actually use it without virtual parameters, since all that it does is to query parameters from TachDB and combine them using a script. It has its own caching system to alleviate TachDB’s load.
8 Managing Complexity
We are often asked what is required to stand up highly configurable SCADA systems. Here, we wanted to create an outline of the major systems involved making OnPing work. The development of each system required a huge amount of effort and care to architect according to the greater vision of a more simple, secure and easy to use automation platform. Together they compose a unique and integrated system for managing data and devices for industrial applications.
The main lesson we have learned is that managing complexity is the key to keeping these systems understandable and maintainable. We have designed the OnPing systems to scale well and have a high degree of flexibility to absorb new technology and features into the system.
This overview of primary OnPing technical infrastructure is meant to distill the essence of OnPing into a simple, functional model of the platform.
Fundamentally, OnPing aims to reduce complexity and make data make sense. Simplifying complicated technical processes in system orchestration enables us to focus on what matters most – building better automation systems.