
Introduction #
This document is intended to provide an introduction to creating and using Historical Reports in OnPing. Creating and scheduling automated historical reports to better understand the data will be simplified with these steps.
This guide will explain how to edit the dashboard and create a new panel, followed by adding the report creator and configuring the report parameters, scheduling, step value, headers, format and title. This guide will also explain how to generate a report and view the results, allowing further insights into the historical data. If you have any questions, the OnPing support team is here to help.
What is a Historical Graph? #
A historical report is a document that provides a detailed account of a past event or set of events. It typically includes a comprehensive summary of the facts and events surrounding the occurrence and an analysis of the event or events. Historical reports are often used to provide an objective overview of an incident or period of time to gain further insights with the data.
Using Historical Reports #
Using a Historical Report in OnPing allows users to generate reports from data that has been stored over a period of time. By studying the facts and analyzing the information from the historical report, the user will gain an in-depth look into the events and how they may have impacted the present.
Historical reports can also be used to inform users of the decisions about the future, as understanding the past can provide valuable insight on how to approach a similar situation in the future.
Creating a Historical Report in OnPing #
Step 1: Create a New Panel
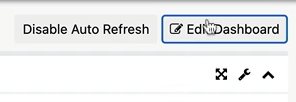
Edit Dashboard
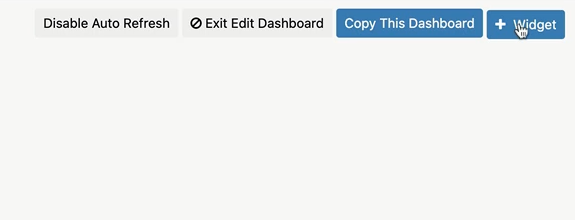
Start by clicking the gray ‘Edit Dashboard’ button from the toolbar at the top right corner of the OnPing window.
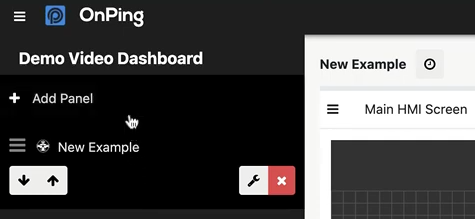
Add Panel
Navigate to the left side of the screen and select the ‘+ Add Panel’ button at the top of the panel display. This will create a new panel for the historical report to be displayed on.
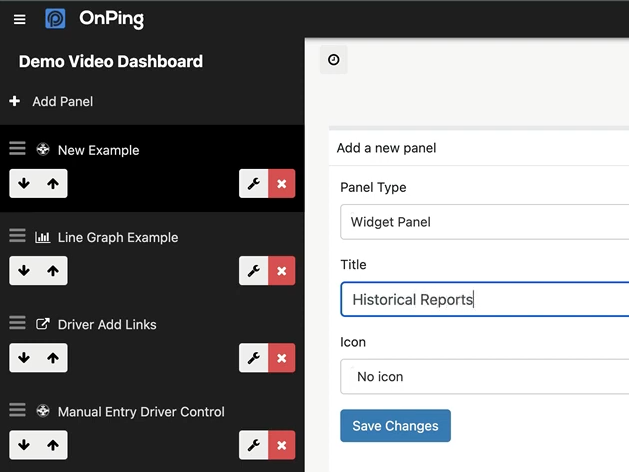
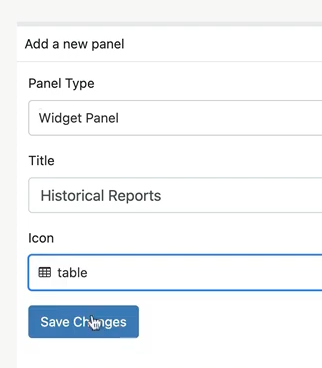
Select the Panel Type. In this example, the panel type will remain the default type ‘Widget Panel’ because the intention is to create a Report Widget on this new panel.
Title the Panel something applicable. In this example, the Title is ‘Historical Reports’.
Select an Icon for the newly created ‘Historical Reports’ Panel. The text bar below ‘Icon’ can be used as a quick search for icons. Click the icon on the options list to select. In this example, the icon ‘table’ is selected.
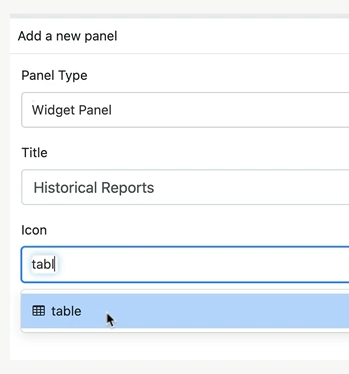
Now the new panel is ready for the ‘Report Creator’ widget. Click the blue ‘Save Changes’ icon at the bottom of the ‘Add a new panel’ window to save the new panel.
A notification from OnPing will appear in the bottom right corner displaying that the Dashboard has been successfully saved.

Step 2: Create a Report Creator Widget
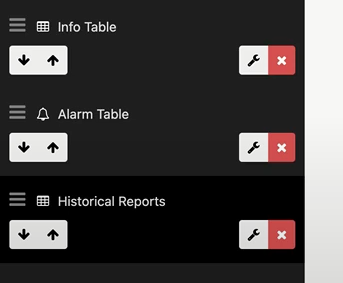
Navigate to the panel list on the left side of the OnPing window and select the ‘Historical Reports’ panel.
Add a Widget
In the panel window, navigate to the right side of the screen and click the blue ‘+ Widget’ button from the panel toolbar.
In the first column of the widgets list, scroll down to the ‘Reports’ section and click the blue ‘Add’ button next to ‘Report Creator’.
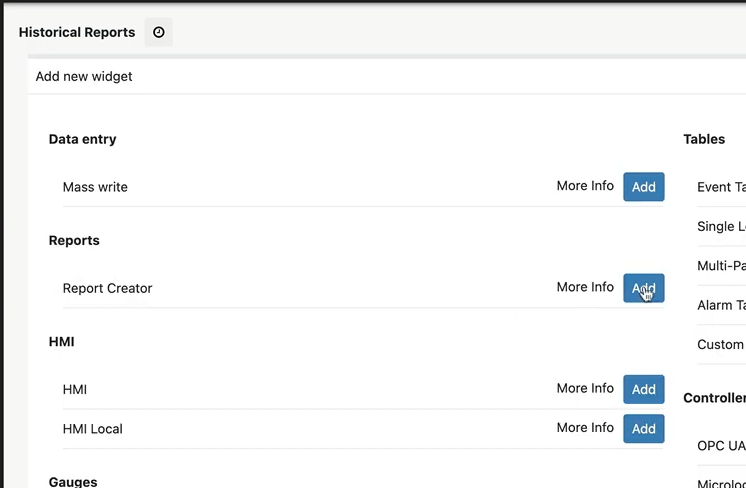
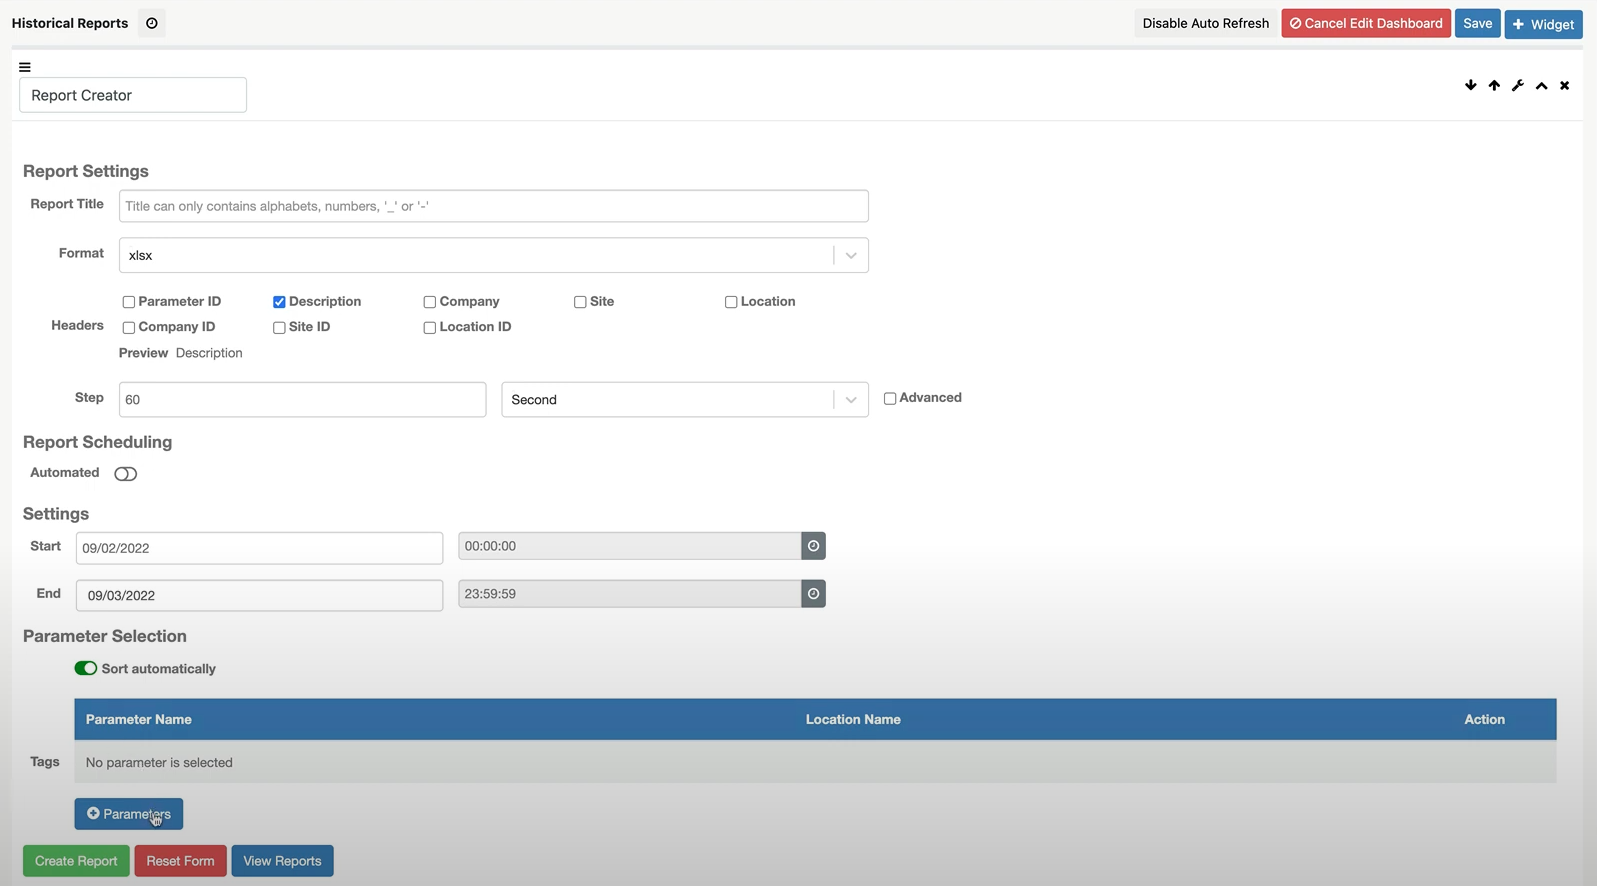
A window to configure the ‘Report Creator’ will appear displaying options to further customize the reports.
Step 3: Configure ‘Report Creator’ Widget
Select Parameters
At the bottom of the Report Creator window, click the blue ‘+ Parameters’ button to add parameters to pull from for the report.

Select the Company, Site, and Location of the target parameters.
In this example, the Company is ‘Plow Demo’, the Site is ‘Best Bread Bakery’ and all of the Locations are selected. To select all the locations, click the gray ‘Select all’ button at the top of the list.

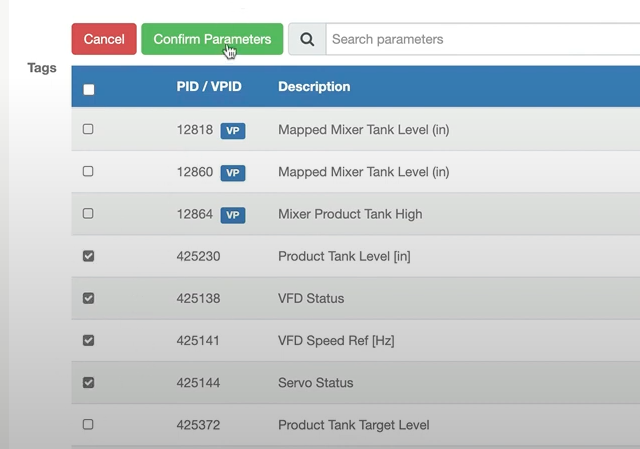
Navigate down to the list of available parameters. Note that virtual parameters are also displayed here. Select the parameters desired for the report. In this example, four parameters are selected: ‘Product Tank Level [in], VFD Status, VFD Speed Ref [Hz], Servo Status’. To select the parameter, click the checkbox to the left of the PID/VPID number.
Once all target parameters are selected, click the green ‘Confirm Parameters’ button at the top of the list.
These parameters will now be displayed in the ‘Parameter Section’ on the ‘Report Creator’ window.

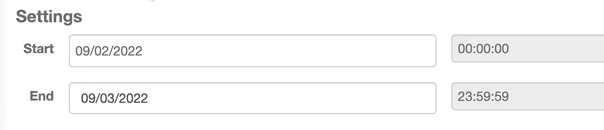
Time Settings
Scroll up and configure the time and date settings here.
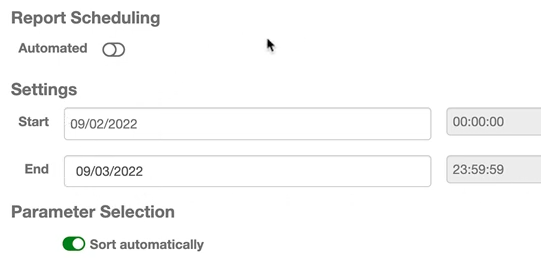
Report Scheduling – Automation Settings
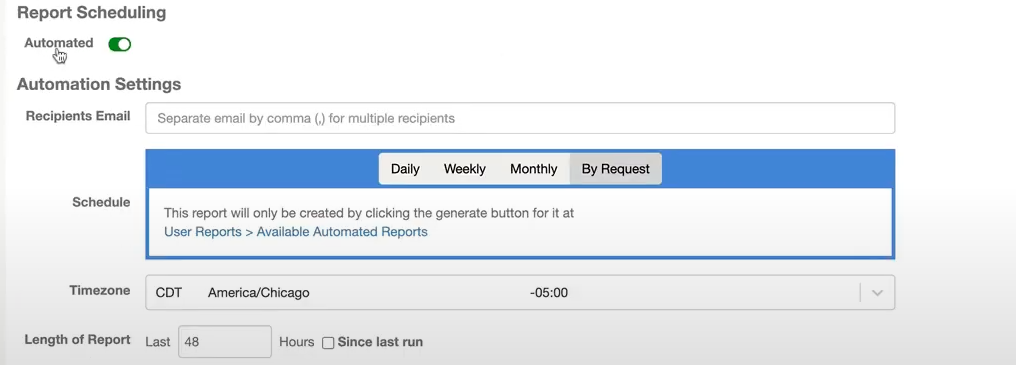
Continue to scroll up and click the switch next to ‘Automated’ under ‘Report Scheduling’ to open the Automation Settings.
These settings include Email Recipients, Schedule, Date, Time, TimeZone, and the Length of Report. The report can be scheduled to be sent on a specific day, specific day of the week, a specific day of the month, and also by request.
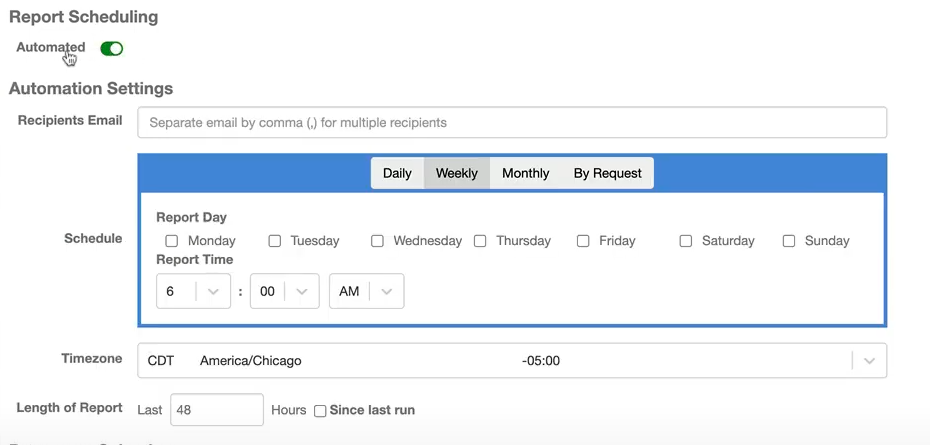
By Request meaning “On Demand” . A manual request to create and send the report.
Additional options to configure the Timezone and Length of Report are available.
In this example, the Report Scheduling will not be automated so the switch next to ‘Automated’ is switched off.
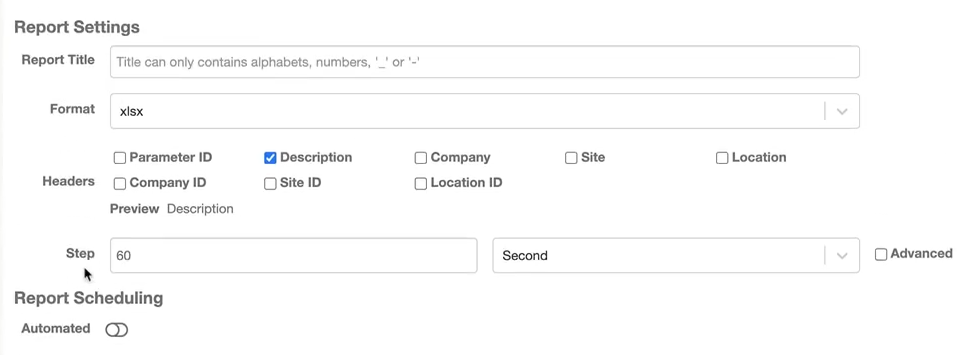
Navigating up to the ‘Report Settings’ section, options to configure the Step Count, Headers, Format, and Title are available.
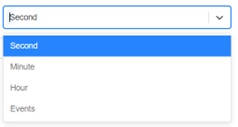
Step Value
How much time there is between pulled data points. In this example, the step time interval is 60 Seconds. This can be configured by typing in a desired number of intervals per second, minute, hour, and event.
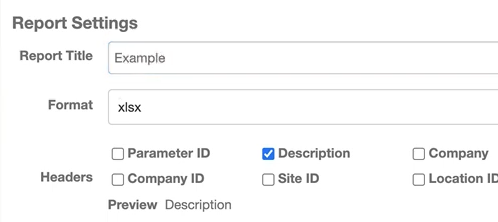
Headers
This is what will be shown in the headers of the historical data report. To select a header option, click the checkbox next to the option. In this example, only one header is chosen, ‘Description’.

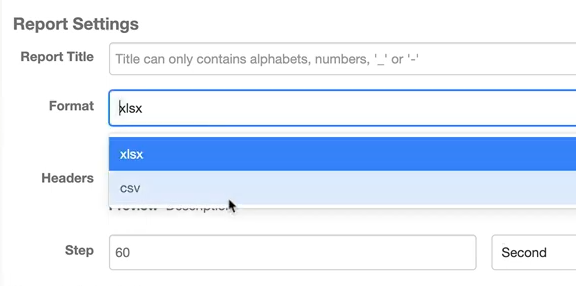
Format – .xlsx and .csv
The report can be exported in two different formats: .xlsx and .csv . To select the file extension, click on the dropdown menu and select the desired option.
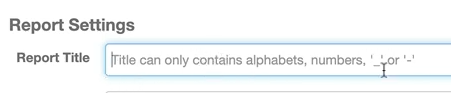
Report Title
The name of the file to be generated. Note Report Titles can only contain the following characters: letters, numbers, ‘_’, or ‘-’
In this example, the report is titled ‘Example’ generating a spreadsheet file: ‘Example.xlsx’
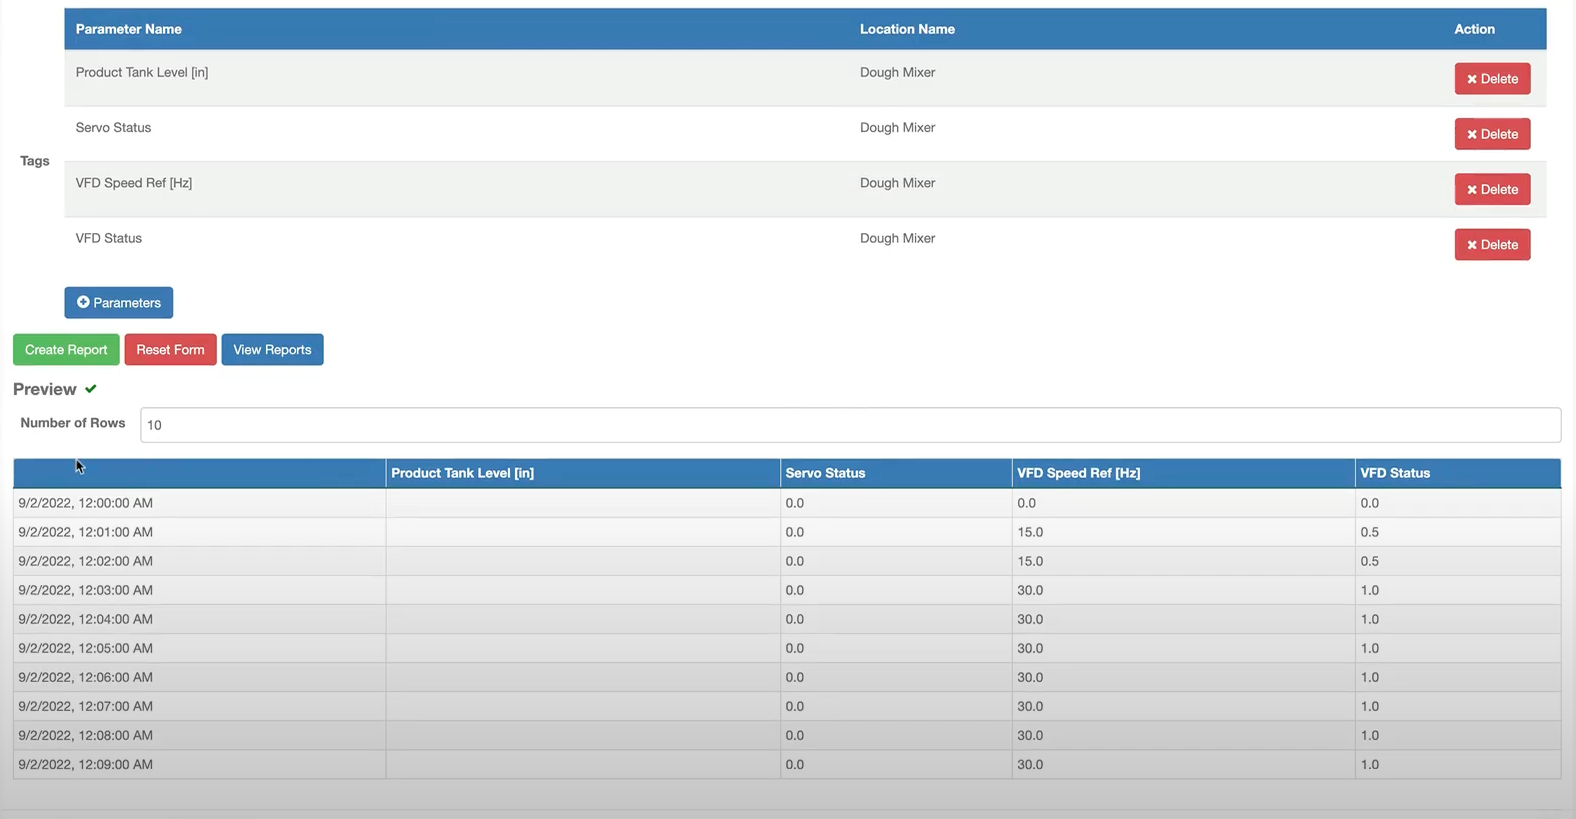
Preview Report
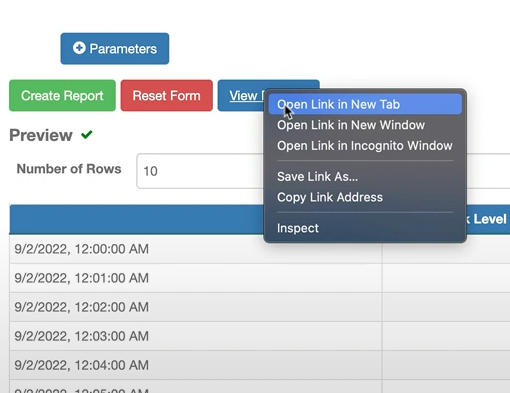
Scroll down to the bottom of the window to preview the report. Note that the columns are the parameters selected earlier in this step. Additional rows can be added by increasing the number of default rows. Type the desired number of rows into the ‘Number of Rows’ text bar.
Step 4: Generate Report File
Create Report
Click the green ‘Create Report’ button above the Preview window.

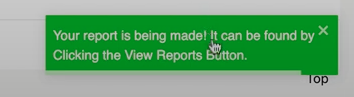
A notification in OnPing will appear in the bottom right corner displaying that the report is being generated. Click on the ‘View Reports’ button to view the new report.
View Reports
Right click on the blue ‘View Reports’ button above the list preview and select ‘Open Link in New Tab’ from the options menu.
This will open another browser tab displaying the previously exported reports.
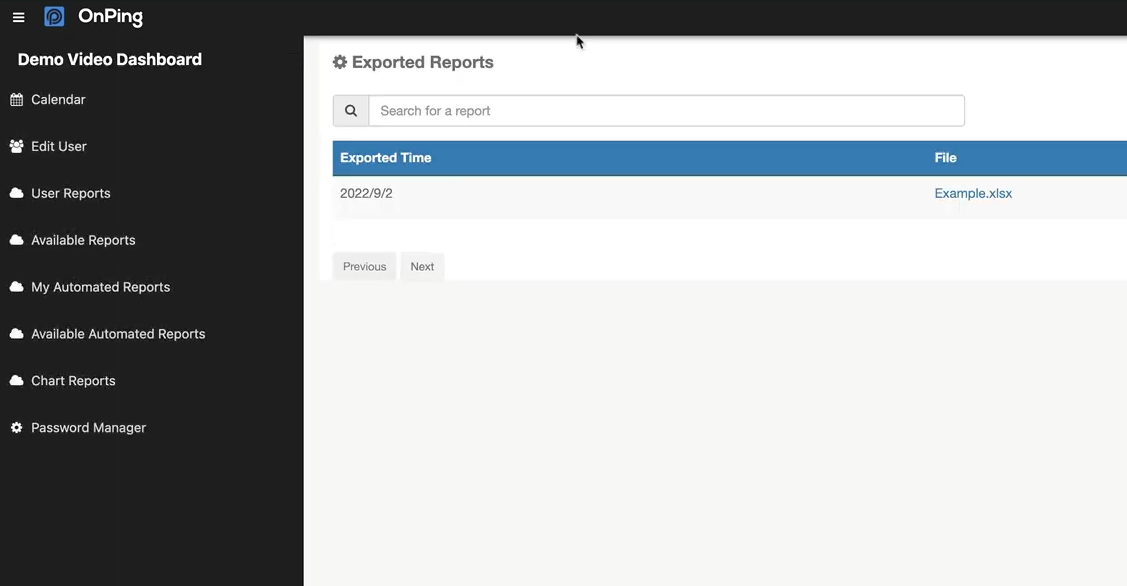
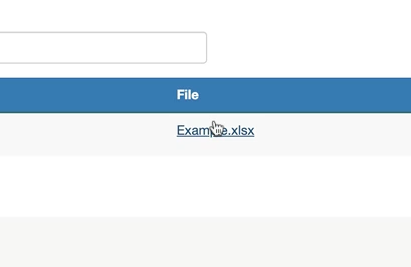
To view a report, click on the text in the ‘File’ column on the Exported Reports window. In this example ‘Example.xlsx’ report is opened and downloaded.
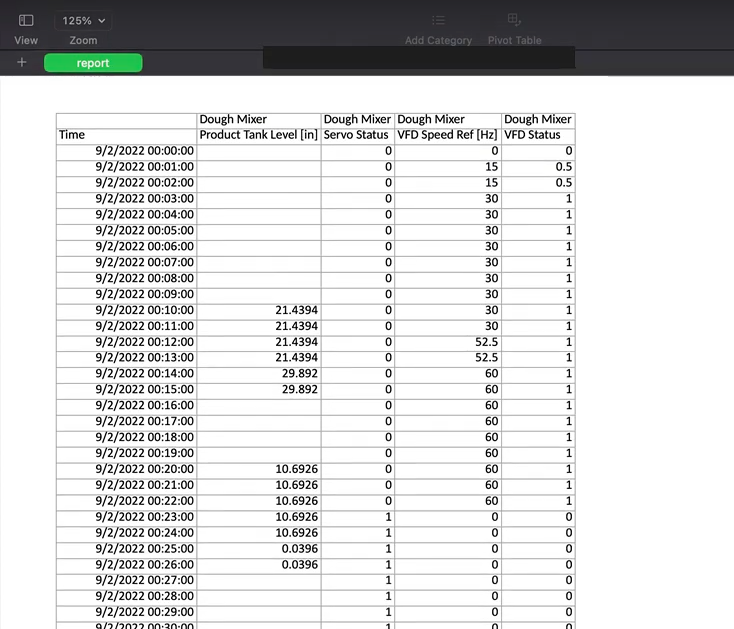
Opening the spreadsheet file in an external program, note the Headers on the table contain the location and the selected parameters as well as the time and date.
Creating a Report ‘By Request’ #
In the event that a historical report is required for a specific date, that can be done by generating a report ‘By Request’. This means that the report can be manually generated for the time and dates selected.
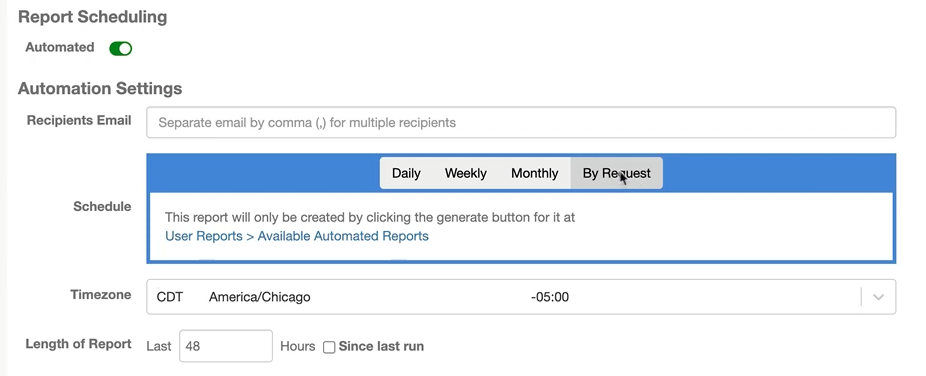
Navigate to ‘Report Scheduling’ in the ‘Report Creator’ window and click the ‘Automated’ switch On. A green background will display on the switch.
A report can be generated and sent ‘By Request’. Select the gray button at the top right of the ‘Schedule’ subwindow labeled ‘By Request’ as shown below.
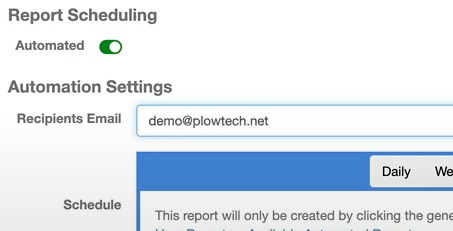
Enter Recipients Email
In this example, the email entered is ‘demo@plowtech.net’. This email address will receive the report when it is sent.
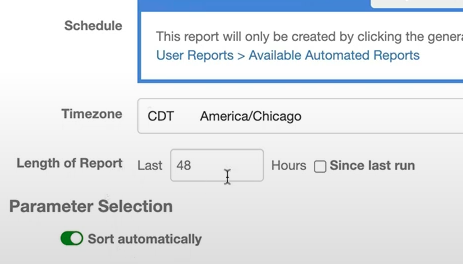
The Timezone can be configured as well as the length of the report.
Length of Report – Since Last Run
A window of hours is required to generate the report. The default window size is 48 hours. That can either be generated into the ‘Last 48 Hours’ or ‘Since Last Run’ – meaning from where the reading is now and when it was last run.
To select the ‘Since Last Run’ option, click the checkbox to the left of ‘Since last run’.
Once the Length of Report settings are configured, navigate down to ‘Parameter Section’ and click the green ‘Create Report’ button.

A notification in OnPing will appear in the bottom right corner stating that the creation of the automated historical report has been successful.

Click the blue ‘View Templates’ button from the same toolbar as ‘Create Report’. This will display a window with the report templates.

The report template ‘Example’ is shown on the ‘My Automated Historical Reports’ window.

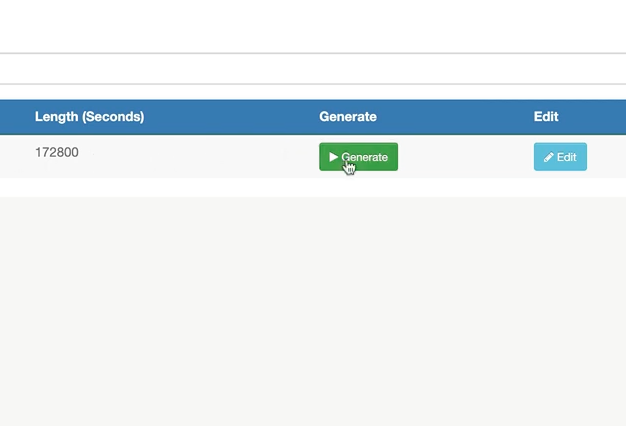
Generate Report Template
Click the green ‘Generate’ button on the right of the screen to generate the report. This will send the ‘Example’ report ‘By Request’ in a Length of 172800 seconds to the email address demo@plowtech.net
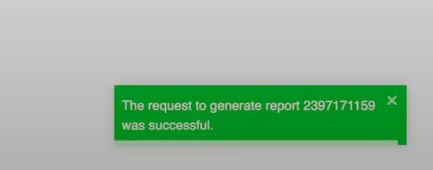
A notification in OnPing will appear stating that ‘The request to generate report 2397171159 was successful. This number will vary depending on the user generated reports.
Conclusion #
Historical Reports in OnPing are an easy and effecient way to generate reports and gain insights into stored data. Through this guide, users are able to create a new panel, add a report creator widget, configure the report parameters, schedule, step values, headers, format and title. The report can then be generated and viewed in a .xlsx or .csv format. Additionally, users can also generate a report ‘By Request’, entering a recipient’s email address and the length of report.
If users do not reap the benefits of Historical Reports in OnPing, they may not have access to the detailed accounts of past events or sets of events which can be used to gain further insights into the data. Without this information, users may be unable to make informed decisions in the future, as they will lack the understanding of how similar situations have been handled in the past.


